Security Onion is used for network security monitoring in which it analyses network traffic and computer logs sent to it by OSSEC, a host intrusion detection system (HIDS). The Overview section of Security Onion’s Github page describes it as a proactive tool, “Network Security Monitoring (NSM) is, put simply, monitoring your network for security-related events. It might be proactive when used to identify vulnerabilities or expiring SSL certificates, or it might be reactive, such as in incident response and network forensics. Whether you’re tracking an adversary or trying to keep malware at bay, NSM provides context, intelligence and situational awareness of your network.”
Security Onion (SO) was designed and is maintained by Doug Burks and is helped with maintenance by Wes Lambert (testing). Support for SO is handled through Google Groups, and you can expect a response within 24 hours but typically less.
If you want or need a primer on the functions and services that SO offers, go here.
You’ll come to equally love and hate SO as we progress through each stage of set up. Security Onion is immensely powerful but takes a lot of patience and time to tune to reduce false positives so that you won’t be chasing ghosts.
If you want to evaluate SO, it’s best to create a virtual machine using VirtualBox. The installation and configuration of VirtualBox and SO are out of the scope of this tutorial series, but you can find that tutorial here.
If you’re evaluating SO, all you’ll need is 3GB of RAM and 2 CPU cores. The primary purpose of the evaluation is to familiarize yourself with the setup steps, options, and values if you’re new to SO, so once you’re ready for a production installation, it’ll be a breeze.
There are two versions of SO where one is based on Ubuntu 12.04, and the other is based on Ubuntu 14.04. You can download version 14.04 here.
Calculating Traffic
You need to take care when calculating the volume of traffic on your network because this is used to determine the number of CPU cores, how much RAM, hard drive capacity, and network cards brand, model, and quantity you’ll need. If you have managed switches, which most businesses do, there should be a monitoring tab or link where you can see the number of packets sent and received.
If you’re not working with managed or smart managed switches, you can use a tap or span (catalyst switched port analyzer).
DualComm DCSW-1005PT
I’m using two Netgear ProSafe GS748T’s which have a monitoring tab and a “Switch Statistics” link where you can see the packet volume for the switch. Instead of using the current values, it’s best to reset the counters and get a fresh reading over 48 hours during a typical work week.
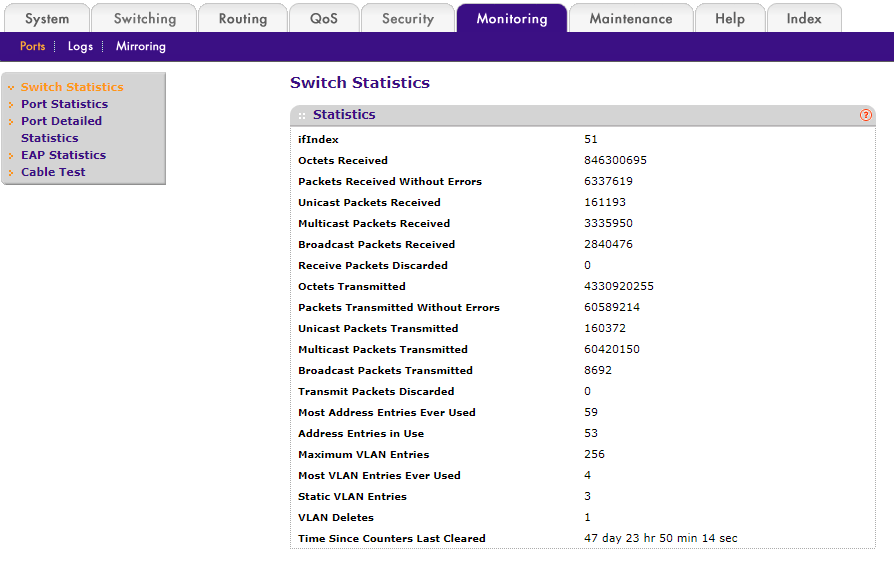
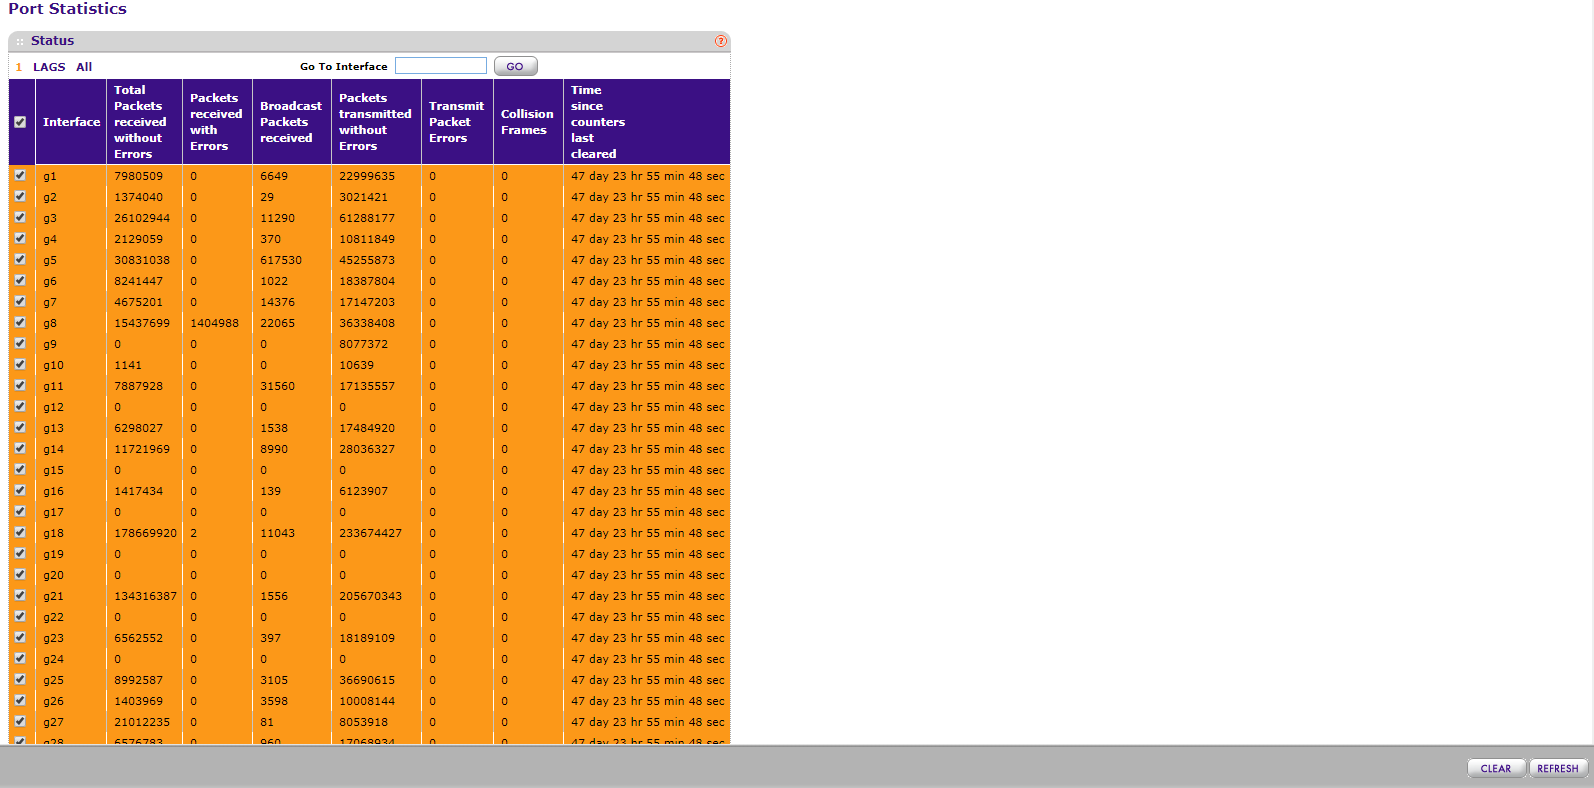
To reset the counters for the GS748T, you’ll need to go to “Port Statistics,” select all of the ports then click “Clear.”
What’s important to remember is that this isn’t kilobytes sent and received so you will need to calculate how much traffic data has been transmitted by taking your total number of packets and multiplying it by the maximum MTU (packet size) which is 1500 bytes. I chose the maximum MTU because it’s better to have a little more hardware resources than what is needed in case of expansion or bursts of data. Since data transfer is measured in seconds you’ll need to take your packet and MTU calculation and divide it by 48 for your hourly rate, then divide by 60 for you per minute rate, then finally divide by 60 again for your per second rate. The last step is to convert from KB to MB if you want to. The conversion for KB to MB is to multiply the KB by .001, or you can perform a Google search using the query “KB to MB.”
The TCP protocol allows for a maximum packet size of 64 Kb in the application layer of the TCP/IP model, but where we’re collecting our data, layer 1, the Ethernet protocol is used that allows a maximum packet size of 1500 bytes or 1.5 Kb.
There are two deployment options that consist of a standalone server and a master server with sensors.
Network Cards
I’ve only ever deployed standalone servers because the networks I have worked with have had moderate (50 Mbps to 100 Mbps) to low (<50 Mbps) traffic volume without VLANs. The SO deployment I’m managing has three network cards, one for each switch then one for the management interface where host logs are sent, and ELSA is accessed.
You’ll get the best performance out of Intel cards, but you’ll also pay the price for that performance. I’m using Rosewill RC-411v3 network cards and haven’t had issues with them up to 150 Mbps to 200 Mbps. If you’re in the low to medium traffic volume range save the money and go with a non-Intel network card. The Intel cards have enough processing power where it can handle TCP offloading which can reduce CPU load.
For more information on TCP offloading, follow this link.
CPU
If you’re deploying the master server and sensor configuration most of your hardware expense is going to go into the sensors.
The sensor is where Snort, Suricata, and Bro reside and perform correlation of host logs, network traffic, and scanning for malicious traffic. One Snort, Suricata, and Bro instance (one instance per CPU thread) can handle ~200 Mbps give or take 50 Mbps. For moderate and low traffic networks you’ll only need one instance (thread) for Snort/Suricata and Bro (you can’t run Snort and Suricata together). In our scenario, the minimum number of cores you’ll want in a sensor is four (2 for Snort and Bro and 2 for the operating system), and the higher the clock rate, the better to reduce dropped packets.
The master server is where you’ll access ELSA where you can view PCAP’s (packet captures), and all other data that Snort/Suricata and Bro collect and correlate so the hardware requirements won’t be as high. Doug Burks recommends a CPU with one to four cores, and lower clock rates won’t hinder performance.
A standalone deployment is going to have to be beefy because you’ll not only be running scanning and correlation services you’ll also be running ELSA. My deployment has a dual-core with hyperthreading Intel i5-650 at 3.2 GHz that is sufficient after I tuned Snort (throttled and suppressed signatures). The average traffic volume for my network is ~12 Mbps with bursts up to 150 Mbps (LAN and Internet traffic). My deployment was dropping up to 60% to 70% of packets during bursts before I tuned it so that a newer CPU will give you better pre-tune results. 12 Mbps might not seem like a lot, but with over 50,000 signature enabled by default, a system can be quickly overloaded especially during bursts.
To keep costs down by avoiding the purchase of a video card you should use a CPU that has integrated graphics. Intel is the first manufacturer to come to mind since all of their CPU’s come with integrated graphics except for their 8th generation X CPU’s. Once again, you’re going to pay a premium with Intel with the exception being the 7th generation Pentium G4560T or G4600T. The G4560T and G4600T are dual-core with hyperthreading at 2.9 GHz and 3 GHz respectively which, based on the new architecture, should be enough horsepower for low to medium traffic volume networks.
Where you get the most bang for your buck is AMD. The older AMD APU’s A4 through the A10 generation 3xxx to 9xxx won’t give you enough processing power, the new Ryzen 3 2200G will do the trick with 4 cores at 3.5 GHz.
RAM
Linux is RAM heavy, meaning; it will use as much RAM as it can. For a master server, Doug recommends 8GB to 16GB of RAM while a sensor will vary based on your traffic volume and running services. If you don’t have enough RAM SO will write data to the hard drive, called swap space, that is supposed to go to RAM. Swap space is far slower than RAM, and your deployments performance will suffer by dropping packets and increase the amount of time it takes for analysis.
Sensor
8GB is recommended for low traffic deployments.
16GB to 128GB for medium to high volume traffic networks (50 Mbps to 500 Mbps).
128GB to 256GB or more for deployments with the traffic volume of 500 Mbps to 1 Gbps.
Standalone
My standalone deployment at ~12 Mbps with Snort, Bro, and ELSA running uses, on average, 85% of the 12GB of RAM that’s installed.
At 50 Mbps you’ll want 24GB or 32GB of RAM.
At 100 Mbps to 500 Mbps you’ll want 64GB to 128GB of RAM.
At 500 Mbps to 1 Gbps you’ll want 256GB or more RAM.
Since a large portion of So’s performance is RAM dependent, it would be a good idea to get high-frequency RAM. DDR3 1600 MHz or 1866 MHz is good, but if you have a processor that supports DDR 4 then get memory that is 2400 MHz or faster.
Storage
If you have full packet capture and ELSA enabled you’ll need a lot of storage that is local. It’s not a good idea to use a SAN, NAS, FibreChannel, or iSCSI because it’s a single point of failure and has the potential to be a bottleneck.
12 Mbps multiplied by .125 gives you the transfer rate in MBps which comes out to 1.5 MBps. 1.5 MBps over the course of a minute comes out to 90 MB, and since there are 60 minutes in an hour you multiply 90 by 60, and you get 5,400 MB or just over 5 GB. Finally, you multiply 5,400 by 24 to give you the amount of data captured and stored in a day which comes out to 129,600 MB or a little over 126 GB.
The number of days you need or want to have data stored for analysis will determine the capacity of the hard drive or drives you will buy. Half of the storage capacity is used for ELSA, and the other half is used for packet captures. If you use a 1 TB drive for my network, you’ll be able to store about four days worth of logs and packet captures. You need to figure out what the number of days for retention is by capacity, then double it. It never hurts to have more storage then you need.
Quality matters as much as capacity. I took an unscientific poll on Twitter that had only 27 respondents.
Which brand/model of hard drive do you use in your SIEM (Security Onion etc.). If your drive isn't listed, put it in the comments.
— Giggle McGiggles (@someinfosecguy) February 19, 2018
As you can see the Western Digital Black drive is the winner and is the drive I use. To my surprise, the Seagate Constellation drive didn’t get any votes, and the surprise lies in that they are highly reliable drives with over 200 MB/s throughput.
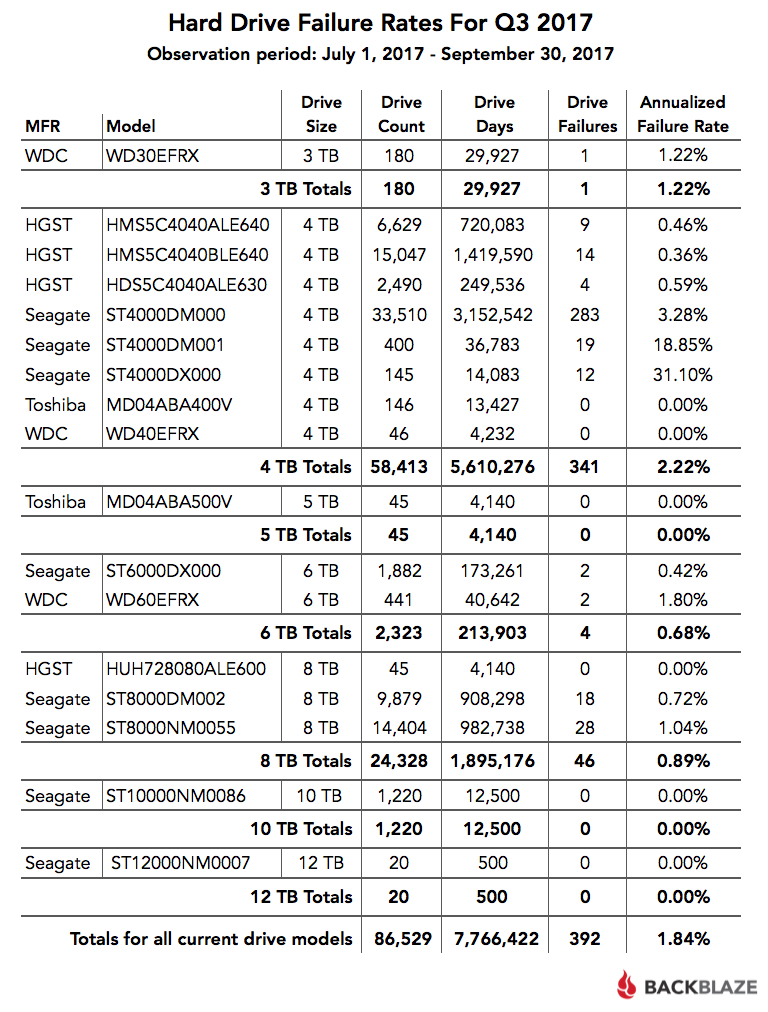
Thankfully, Backblaze, a cloud storage company, issues a quarterly report on the performance of the drives they use that includes the drive manufacturer, model, size, count, days in operation, failures, and annualized failure rates.
UPS
Use one.